Portfolio Structure · 6 min read
Oil in a Portfolio: 125 Years of Booms, Busts, and What They Teach
Oil is one of the most volatile things an investor can own. Adjusted for inflation, the U.S. crude price rose 555% from 1998 to 2008, then fell 63% by 2016. It has tended to rise with inflation and move against stocks, which is why a modest, deliberate slice can help a portfolio and a large one can undo a plan.
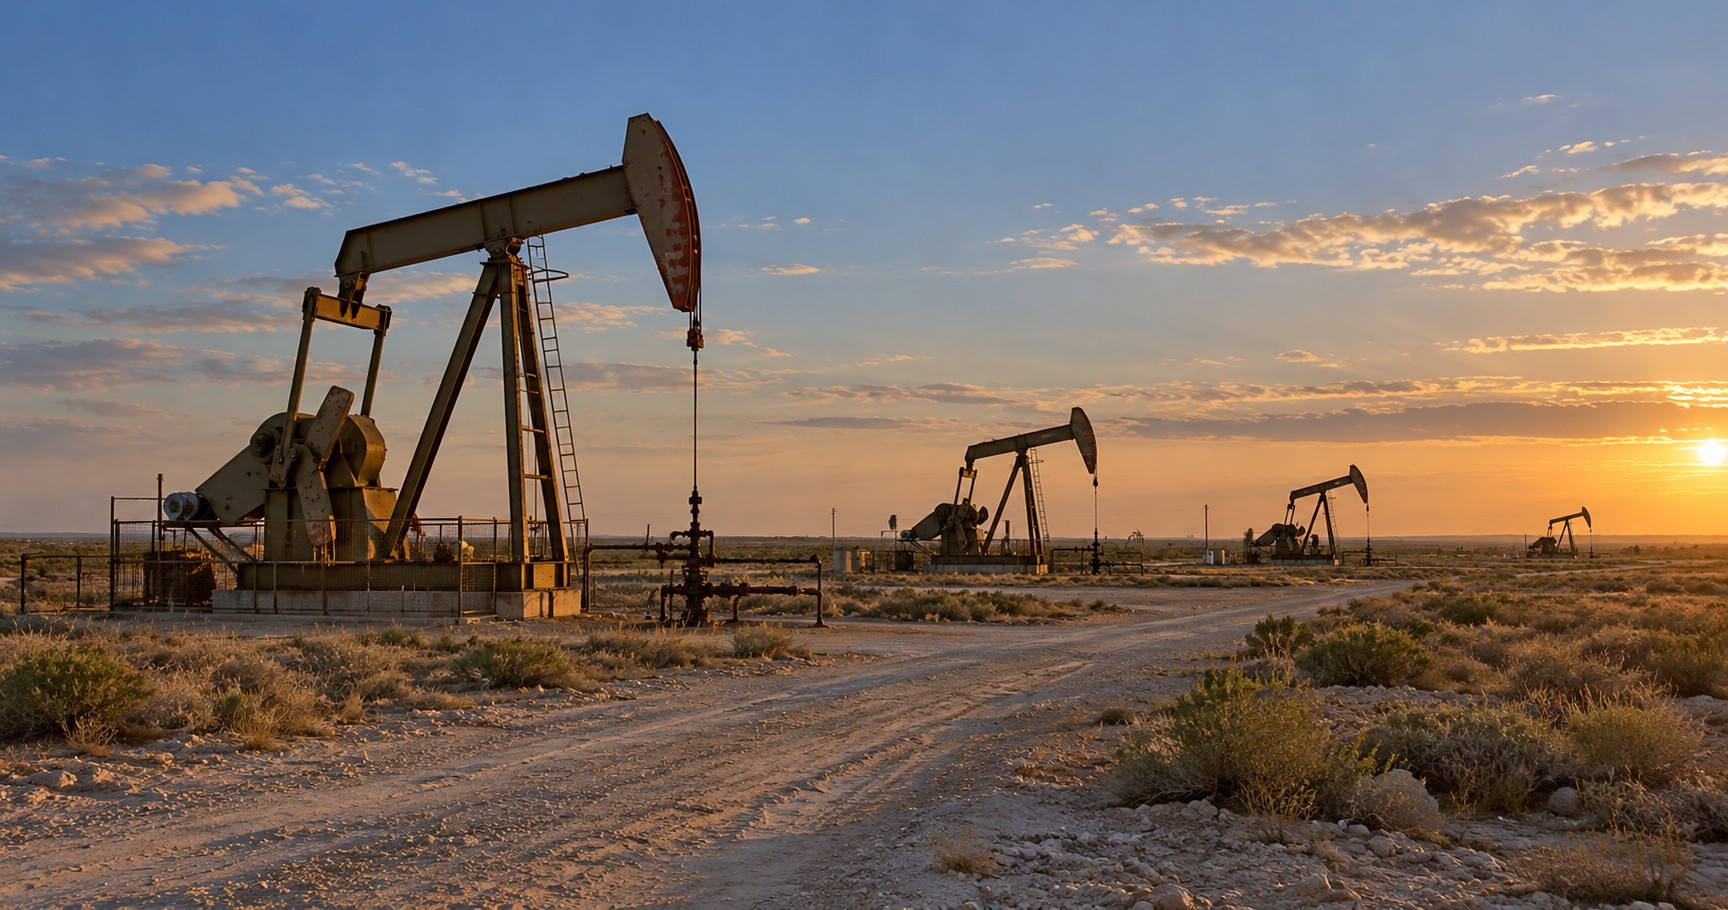
In March 2026 oil was front-page news again. The Brent crude spot price rose from $77.24 a barrel on March 2 to $118.09 on March 18 and reached $138.21 on April 7 (EIA, Brent spot). Moves like that send investors to the same question: should a portfolio own more oil?
The question deserves a longer view than one spring. We looked at 125 years of U.S. crude oil prices, adjusted for inflation, to see what the booms and busts teach about owning oil in a portfolio, and how much of it a household really needs.
Chart
U.S. crude oil in today's dollars, 1900 to 2025
Average annual price paid for U.S. crude oil, adjusted for inflation to 2025 dollars per barrel.
Source: U.S. Energy Information Administration (crude oil first purchase price) · inflation adjustment with CPI-U (Shiller/Yale; BLS annual averages from 2022) · annual
View the data
| Year | Price in 2025 dollars |
|---|---|
| 1900 | $49.05 |
| 1901 | $40.19 |
| 1902 | $31.48 |
| 1903 | $36.52 |
| 1904 | $33.45 |
| 1905 | $23.88 |
| 1906 | $27.42 |
| 1907 | $25.56 |
| 1908 | $26.53 |
| 1909 | $23.88 |
| 1910 | $20.10 |
| 1911 | $21.80 |
| 1912 | $24.81 |
| 1913 | $30.95 |
| 1914 | $26.03 |
| 1915 | $20.38 |
| 1916 | $32.54 |
| 1917 | $39.16 |
| 1918 | $42.38 |
| 1919 | $37.33 |
| 1920 | $49.32 |
| 1921 | $31.20 |
| 1922 | $30.94 |
| 1923 | $25.30 |
| 1924 | $26.88 |
| 1925 | $30.83 |
| 1926 | $34.20 |
| 1927 | $24.11 |
| 1928 | $21.95 |
| 1929 | $23.83 |
| 1930 | $22.94 |
| 1931 | $13.76 |
| 1932 | $20.53 |
| 1933 | $16.68 |
| 1934 | $24.06 |
| 1935 | $22.75 |
| 1936 | $25.31 |
| 1937 | $26.41 |
| 1938 | $25.82 |
| 1939 | $23.61 |
| 1940 | $23.44 |
| 1941 | $24.92 |
| 1942 | $23.46 |
| 1943 | $22.32 |
| 1944 | $22.14 |
| 1945 | $21.83 |
| 1946 | $23.26 |
| 1947 | $27.83 |
| 1948 | $34.82 |
| 1949 | $34.35 |
| 1950 | $33.58 |
| 1951 | $31.38 |
| 1952 | $30.68 |
| 1953 | $32.23 |
| 1954 | $33.33 |
| 1955 | $33.31 |
| 1956 | $33.04 |
| 1957 | $35.41 |
| 1958 | $33.58 |
| 1959 | $32.03 |
| 1960 | $31.35 |
| 1961 | $31.13 |
| 1962 | $30.86 |
| 1963 | $30.38 |
| 1964 | $29.89 |
| 1965 | $29.22 |
| 1966 | $28.57 |
| 1967 | $28.18 |
| 1968 | $27.21 |
| 1969 | $27.12 |
| 1970 | $26.37 |
| 1971 | $26.95 |
| 1972 | $26.10 |
| 1973 | $28.21 |
| 1974 | $44.86 |
| 1975 | $45.88 |
| 1976 | $46.33 |
| 1977 | $45.52 |
| 1978 | $44.42 |
| 1979 | $56.07 |
| 1980 | $84.35 |
| 1981 | $112.49 |
| 1982 | $95.15 |
| 1983 | $84.66 |
| 1984 | $80.20 |
| 1985 | $72.10 |
| 1986 | $36.74 |
| 1987 | $43.63 |
| 1988 | $34.25 |
| 1989 | $41.19 |
| 1990 | $49.35 |
| 1991 | $39.10 |
| 1992 | $36.69 |
| 1993 | $31.76 |
| 1994 | $28.65 |
| 1995 | $30.89 |
| 1996 | $37.89 |
| 1997 | $34.56 |
| 1998 | $21.47 |
| 1999 | $30.07 |
| 2000 | $49.96 |
| 2001 | $39.71 |
| 2002 | $40.29 |
| 2003 | $48.23 |
| 2004 | $62.67 |
| 2005 | $82.89 |
| 2006 | $95.33 |
| 2007 | $103.29 |
| 2008 | $140.62 |
| 2009 | $84.56 |
| 2010 | $110.30 |
| 2011 | $137.01 |
| 2012 | $132.54 |
| 2013 | $132.66 |
| 2014 | $118.84 |
| 2015 | $60.30 |
| 2016 | $51.36 |
| 2017 | $63.11 |
| 2018 | $78.72 |
| 2019 | $70.00 |
| 2020 | $45.85 |
| 2021 | $78.23 |
| 2022 | $103.37 |
| 2023 | $80.41 |
| 2024 | $76.48 |
| 2025 | $63.41 |
What 125 years of oil prices show
Measured in 2025 dollars, the average price paid for U.S. crude was $49.05 a barrel in 1900 and $63.41 in 2025 (EIA, crude first purchase price). Along the way it fell as low as $13.76 in 1931 and rose as high as $140.62 in 2008. We restate every year in 2025 dollars using the Consumer Price Index, so the chart compares the same money across a century (CPI-U via Shiller data; BLS).
Two features stand out. The first is how long the quiet stretches lasted: from 1946 to 1972 the real price stayed between $23.26 and $35.41 a barrel. The second is how violent the loud stretches were. In 14 of the last 125 years the real price rose more than 30%, and in 7 it fell more than 30%.
The booms and busts that made and erased fortunes
| Period | What drove it | Change in the real price |
|---|---|---|
| 1972 to 1980 | The 1973 embargo and the 1979 revolution in Iran | +223% |
| 1980 to 1986 | Demand fell and new supply arrived | -56% |
| 1998 to 2008 | Fast-growing demand from emerging economies | +555% |
| 2008 to 2016 | The financial crisis, then new U.S. shale supply | -63% |
| 2019 to 2020 | The pandemic shutdown | -35% |
| 2020 to 2022 | Reopening demand and the war in Ukraine | +125% |
Annual averages understate how wild single days can be. On April 20, 2020, the spot price of West Texas Intermediate, the U.S. benchmark, fell to minus $36.98 a barrel (EIA, WTI spot). For one day, sellers with oil due for delivery paid buyers to take it.
The table also shows who kept the fortunes. Buyers who arrived after a boom had already run waited a long time: someone who bought at the 1981 real peak of $112.50 waited 27 years, until 2008, to see that price again. The 2008 peak of $140.62 has not been reached since. The gains went to people who held oil before the boom, and the losses to people who bought after the headlines.
A short history of the oil shocks
1973 and 1979. Two supply shocks, an Arab oil embargo and then the revolution in Iran, took the real price from $26.10 a barrel in 1972 to $84.35 in 1980 and $112.50 in 1981. Gasoline lines and double-digit inflation followed, and the experience shaped a generation of investors.
1986 to 1998. High prices had cut demand and drawn in new supply from outside the Middle East. When producers stopped holding back output, the real price fell to $36.74 in 1986 and stayed low for more than a decade, reaching $21.47 in 1998.
The 2000s. Rapid growth in emerging economies pushed demand ahead of supply, and the real price climbed to $140.62 in 2008, the highest annual average in the record.
2014 to 2016. New production from U.S. shale fields added supply faster than the world could use it. The real price fell from $118.84 in 2014 to $51.36 in 2016.
2020 to 2022. Pandemic shutdowns cut demand so abruptly that storage ran short. Two years later, reopening demand and the war in Ukraine took the real price to $103.37 in 2022.
Each boom looked permanent while it lasted, and so did each bust. That is the pattern worth remembering when the next headline arrives.
How oil moves with inflation, and with stocks
The case for oil in a portfolio rests on two relationships we measured over 1946 to 2022. The yearly change in the oil price and the yearly inflation rate had a correlation of +0.54: in years when prices across the economy rose faster, oil usually rose too. The yearly change in the real oil price and the real total return of U.S. stocks had a correlation of -0.35: oil tended to do better in the years stocks did worse (our calculation from EIA and Shiller data).
The 1970s show why that matters. Inflation averaged 7.1% a year, and U.S. stocks with dividends reinvested lost 1.1% a year after inflation (Shiller data). Over roughly the same stretch, the real oil price more than tripled.
These are averages, not rules. Correlations of that size mean the pattern held often, not always. In 2008 oil and stocks fell together, and from 2014 to 2016 oil lost more than half its real value in a decade when U.S. stocks returned 11.6% a year after inflation.
What oil costs a household directly
Oil reaches a retirement plan even without owning a barrel. Gasoline, heating, airfare and the cost of shipping almost everything a household buys rise with energy prices, and they flow into the Consumer Price Index. An oil shock is often an inflation shock for the household budget first and a portfolio question second. Our companion guide on inflation and retirement plans covers that side.
The ways investors own oil, and what each really holds
- Energy company stocks. Shares of producers, refiners and pipeline companies follow oil only in part, because their prices also reflect debt, costs, dividends and the broader market. A broad U.S. stock index fund already owns them.
- Commodity futures funds. These hold contracts for future delivery, not barrels. As each contract nears expiry the fund sells it and buys a later one, and the gap between the two prices can add to or subtract from returns. A futures fund can trail the spot price for years.
- Partnerships and royalty trusts. These pass through income from pipelines or production. The income can be attractive; the tax reporting is more involved than for a stock or fund.
Each of these is a different bet. Knowing which one a holding represents is the first step in deciding whether it belongs.
The concentration question for energy households
In Houston and across Texas, many households already hold a large, quiet position in oil. The paycheck, the bonus, restricted stock or performance shares, a pension, and often the value of the home all move with the same industry. For an energy employee, adding an oil fund to the brokerage account can mean doubling the risk that already drives the household's income. Our guides on Chevron equity awards, ExxonMobil restricted stock and concentrated stock positions walk through that exposure in detail.
How we think about sizing oil
- Name the job first. A small holding meant to cushion an inflation shock is a different decision from a bet on higher prices.
- Size it to survive the bust. The real price fell 63% from 2008 to 2016. The right size is one the household could hold through a fall like that without changing its plans.
- Count what is already there. Broad stock funds, employer stock and career income all carry energy exposure.
- Set the rebalancing rule in advance. Trimming after a spike and adding after a slump feels wrong in the moment, and it is the discipline that turns volatility into something useful.
- Be wary of buying after a run. The longest waits in the history above began at peaks.
How this may apply to your plan
If oil headlines have you wondering whether to add energy, or whether to trim what you hold, start with three questions: how much of your income, stock and home value already depends on energy, what job an oil holding would do, and how large a fall you could live with. We can map that exposure across accounts, employer stock and cash flow, and set a size and a rebalancing rule before the next headline arrives.
Sources and further reading
- U.S. Energy Information Administration, U.S. crude oil first purchase price, annual
- U.S. Energy Information Administration, Europe Brent spot price FOB, daily
- U.S. Energy Information Administration, Cushing, OK WTI spot price FOB, daily
- Robert J. Shiller, Yale University, U.S. stock market, dividend, CPI and interest-rate data since 1871
- U.S. Bureau of Labor Statistics, Consumer Price Index (CPI-U), annual averages
- U.S. Bureau of Labor Statistics, CPI for All Urban Consumers (CPI-U), U.S. city average, annual averages
Next steps
Keep reading



Get the weekly market brief.
Once a week, we send a concise roundup of the most important market stories and what they may mean for financial markets, portfolio decisions, and planning strategy.
The views and opinions expressed here are those of The Financial Sciences Company as of the publish date and are provided for informational and educational purposes only. They are not personalized investment, tax, or legal advice. The Financial Sciences Company, LLC is a registered investment adviser. Registration does not imply a certain level of skill or training. Additional information is available in our Form ADV at adviserinfo.sec.gov.
General educational information, current as of 2026. Figures and rules change. For guidance specific to your situation, speak with a qualified professional.